AI Squared
Overview
AI Squared helps organizations embed AI/ML models directly into the tools their teams already use — turning predictions into decisions, not just data.
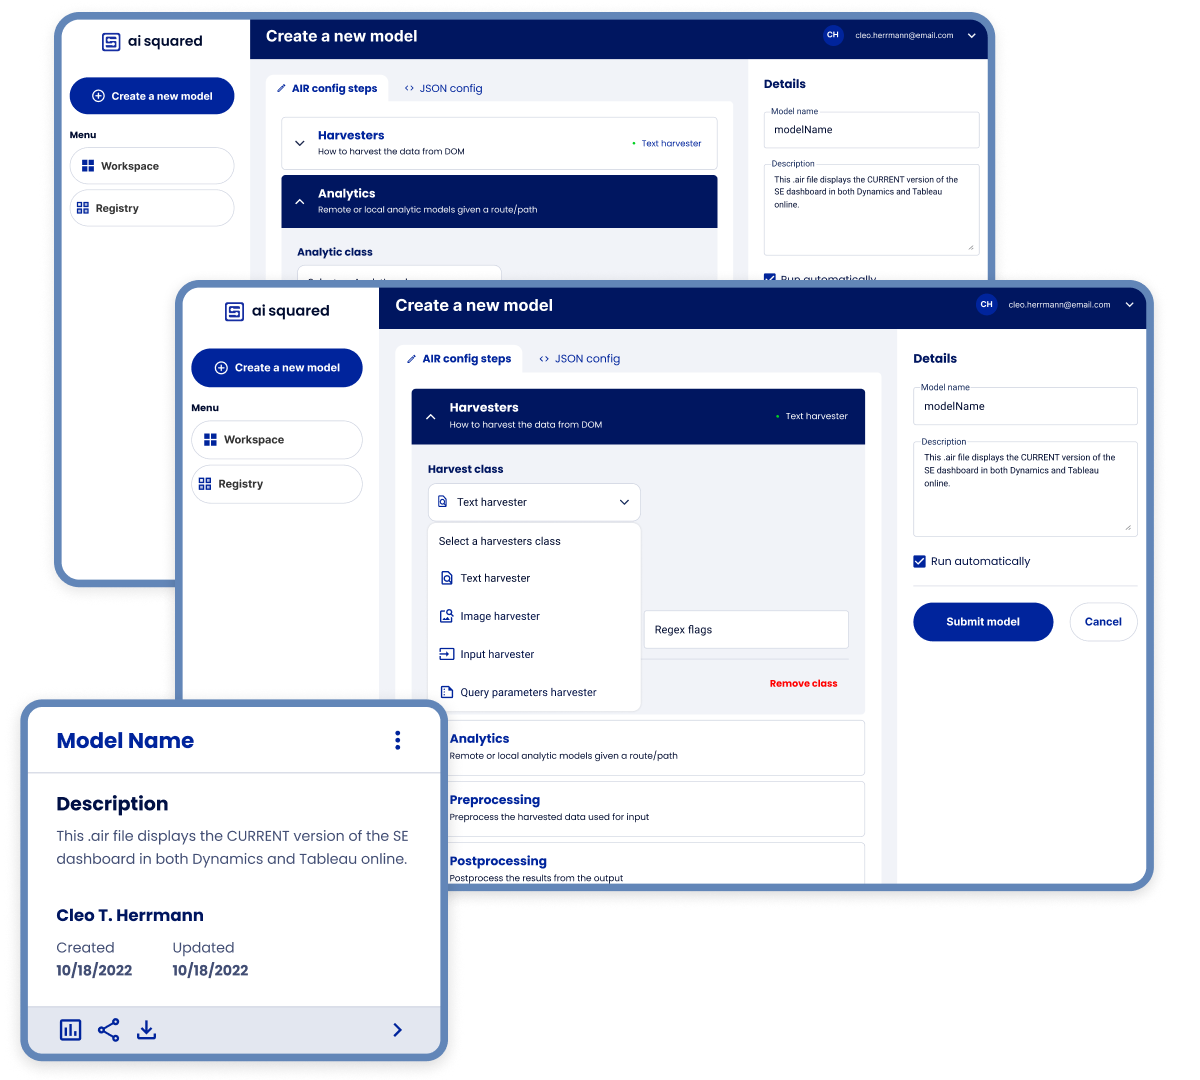
In 2022, I led the end-to-end redesign of their core dashboard: a central workspace where teams build, deploy, monitor, and operationalize AI models. The original interface was powerful under the hood, but difficult to navigate, hard to demo, and inaccessible to anyone outside engineering.
My goal was to fix that — designing an experience that works for engineers and business stakeholders alike.
Timeframe:
July-November 2022
My role:
Senior UX Product Designer
Team:
1 Designer (me) · 1 PM · 3 Engineers
Company
AI Squared (Website)
The Challenge
The original dashboard was built for engineers — dense, log-heavy, and difficult to navigate for anyone without deep technical context. Business users like Sales and Operations were largely locked out of the value the models were generating.
Even basic tasks — checking model status, understanding deployment health, or reviewing prediction output — required digging through scattered UI elements with no clear hierarchy.
Key friction points:
- No centralized view of model performance or user feedback
- Navigation was overwhelming — no role-based context
- Business teams (Sales, Marketing, Ops) couldn't access or act on AI insights
- Demos to clients and stakeholders felt clunky and unconvincing
My Process
I started by auditing the existing dashboard and mapping the four distinct user types the product needed to serve. From there I ran a series of working sessions with the PM and engineering leads to align on scope and surface technical constraints early.
From audit to wireframes, I moved quickly — using low-fidelity flows to validate structure before committing to UI. Usability testing focused on three critical paths: widget integration, role-based view customization, and the model builder flow.
The final design introduced a restructured information hierarchy, role-aware navigation, and a cleaner model performance view — making it significantly easier for both technical and non-technical users to get value from the platform.
Users & Use Cases
The dashboard needed to serve four distinct teams — each with different goals, different technical fluency, and different definitions of success.
Engineering — Build, test, and deploy models faster with a clearer model builder and deployment workflow.
Sales — Surface AI-powered predictions directly in CRM tools to improve lead quality and client retention.
Marketing — Access real-time model output to power personalized campaigns without engineering support.
Operations — Use demand forecasting and resource planning tools grounded in live model data.
Results & Impact
Without formal A/B testing in place, success was measured through stakeholder feedback
and team adoption and the signal was clear.
"This is the first time our models feel truly operationalized."
"The redesigned dashboard made demos and stakeholder presentations significantly smoother and more impactful."
"It's so much easier to showcase value to clients now."
Beyond the quotes: cross-functional adoption increased, the sales team began using the dashboard directly in client demos, and the engineering team reported faster onboarding for new model deployments.
Thank you for coming over!
Lets Talk!
For collaboration or freelance opportunities, please contact me at alexis.blas@me.com. follow me on LinkedIn.